National Election History
NATIONAL PRESIDENTIAL ELECTIONS SUMMARY
YEAR |
CANDIDATES |
VOTES |
PERCENTAGE |
2024 |
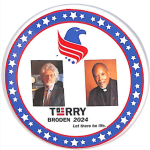
Terry/Broden |
||
2020 |
Blankenship/Mohr |
60,080 |
0.04% |
2016 |
Castle/Bradley |
203,090 |
0.15% |
2012 |
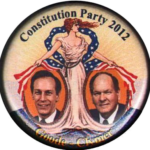
Goode/Clymer |
122,001 |
0.09% |
2008 |
Baldwin/Castle |
199,314 |
0.15% |
2004 |
Peroutka/Baldwin |
143,630 |
0.12% |
2000 |
Phillips/Frazier |
98,020 |
0.09% |
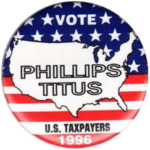
1996 |
Phillips/Titus |
184,656 |
0.19% |
1992 |
Phillips/Knight |
43,398 |
0.04% |
 |
 |
 |
 |
 |
 |
 |
2024 NATION WIDE COMPARISON
Source:
| TRUMP Republican |
HARRIS Democrat |
TERRY Constitution |
OLIVER Libertarian |
STEIN Green |
2020 NATION WIDE COMPARISON
Source: https://www.fec.gov/resources/cms-content/documents/federalelections2020.pdf
| BIDEN Democrat |
TRUMP Republican |
BLANKENSHIP Constitution |
JORGENSEN Libertarian |
HAWKINS Green |
| 81,283,501 | 74,223,975 | 60,080 | 1,865,535 | 407,068 |
| 51.31% | 46.85% | .04% | 1.18% | 0.26% |
2016 NATION WIDE COMPARISON
Source: https://www.fec.gov/resources/cms-content/documents/federalelections2016.pdf
| TRUMP Republican |
CLINTON Democrat |
CASTLE Constitution |
JOHNSON Libertarian |
STEIN Green |
| 62,984,828
Electoral Win |
65,853,514 | 203,090 | 4,489,341 | 1,457,218 |
| 46.09% | 48.18% | 0.15% | 3.28% | 1.07% |
2012 NATION WIDE COMPARISON
Source: https://www.fec.gov/resources/cms-content/documents/2012pres.pdf
| OBAMA Democrat |
ROMNEY Republican |
GOODE Constitution |
JOHNSON Libertarian |
STEIN Green |
| 65,915,795 | 60,933,504 | 122,389 | 1,275,971 | 469,627 |
| 51.06% | 47.20% | 0.09% | 0.99% | 0.36% |
2008 NATION WIDE COMPARISON
Source: https://www.fec.gov/resources/cms-content/documents/2008pres.pdf
| OBAMA Democrat |
MCCAIN Republican |
BALDWIN Constitution |
BARR Libertarian |
MCKINNEY Green |
NADER Independent |
| 69,498,516 | 59,948,516 | 199,750 | 523,715 | 161,797 | 793,034 |
| 52.93% | 45.65% | 0.15% | 0.40% | 0.12% | 0.56% |
Source: Ballot Access News
Best County in Nation for Some Minor Party, Independent Presidential Candidates Identified
Nader: Morgan County, Tennessee 5.2%
Barr: Esmeralda County, Nevada, 2.7%
Baldwin: Millard County, Utah, 5.6%
McKinney: either St. Bernard or Lafourche Parish, both in Louisiana, each 1.1%
Brian Moore: Essex County, Vermont, 2.1%
2004 NATION WIDE COMPARISON
Source: www.fec.gov/pubrec/fe2004/federalelections2004.pdf
| BUSH Republican |
KERRY Democrat |
PEROUTKA Constitution |
BADNARIK Libertarian |
COBB Green |
NADER Reform |
| 62,040,610 | 59,028,444 | 143,630 | 397,265 | 119,859 | 465,650 |
| 50.73% | 48.27% | 0.12% | 0.32% | 0.10% | 0.38% |
2000 NATION WIDE COMPARISON
| BUSH Republican |
GORE Democrat |
PHILLIPS Constitution |
BROWNE Libertarian |
NADER Green |
BUCHANAN Reform |
| 50,456,002 | 50,999,897 | 98,020 | 384,431 | 2,882,955 | 448,895 |
| 47.86% | 48.38% | .09% | .36% | 2.74% | .42% |
1996 NATION WIDE COMPARISON
Source: https://www.fec.gov/resources/cms-content/documents/FederalElections96_PresidentialGeneralElectionResults.pdf
| CLINTON Democrat |
DOLE Republican |
PHILLIPS Constitution |
BROWNE Libertarian |
PEROT Reform |
| 47,401,185 | 39,197,469 | 184,656 | 485,759 | 8,085,294 |
| 49.24% | 40.71% | 0.19% | 0.50% | 8.40% |
1992 NATION WIDE COMPARISON
Source: https://www.fec.gov/resources/cms-content/documents/federalelections92.pdf
| CLINTON Democrat |
BUSH Republican |
PHILLIPS Constitution |
MARROU Libertarian |
PEROT Independent |
| 44,909,889 | 39,104,545 | 43,398 | 291,628 | 19,742,267 |
| 43.01% | 37.45% | .04% | .28% | 18.91% |